Compare Lotteries
STATEMENT OF OPERATIONS
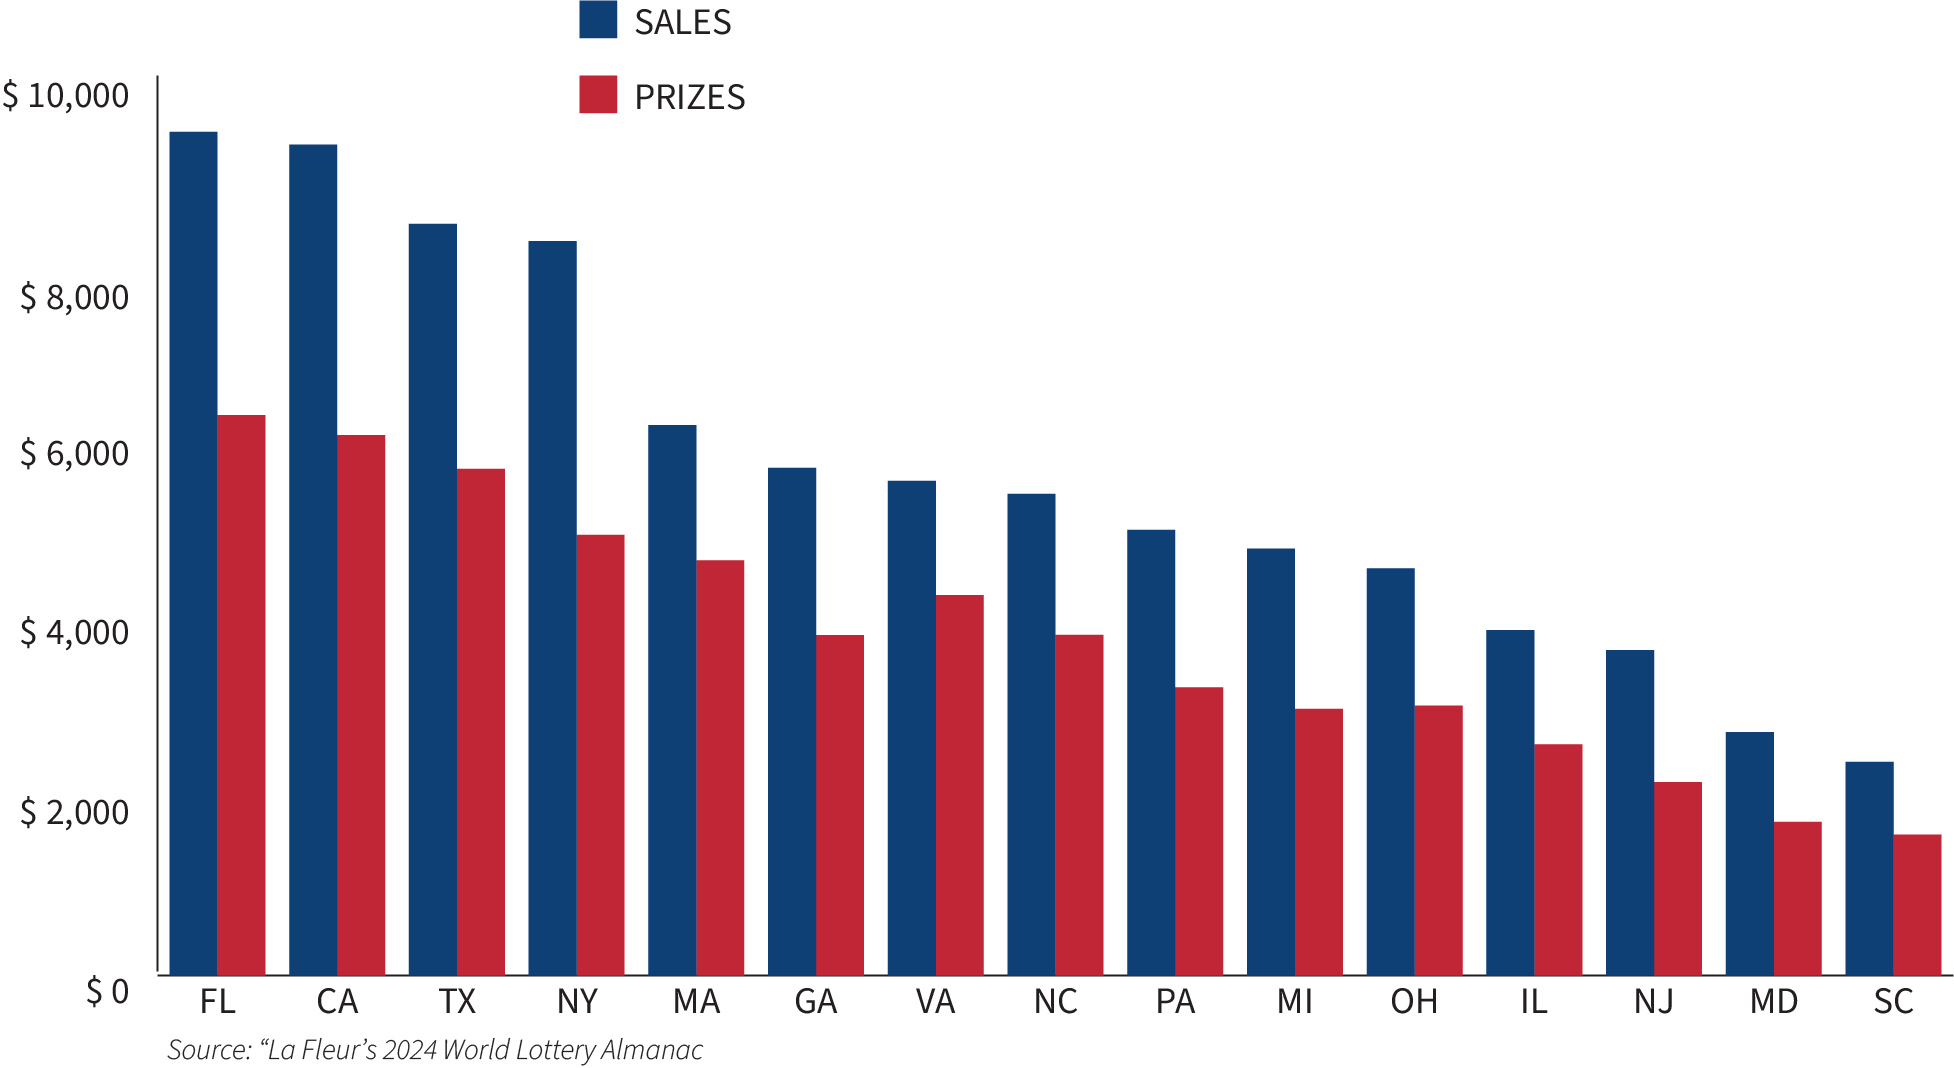
RANK BY SALES(a) FISCAL YEAR 2024(b)
(in Millions)
RANK BY SALES(a) FISCAL YEAR 2024(b)
(in Millions)
U.S. Lottery |
Population |
Ticket Sales |
Prizes |
Bonuses/
|
Operating Expenses |
Prizes as % of Total Sales |
Per Capita Sales |
||
|---|---|---|---|---|---|---|---|---|---|
| 1 | Florida | 22.4 | 9417.5 | 6254.7 | $571.6 | $213.8 | 66.4% | $403 | |
| 2 | California | 39.4 | 9275.1 | 6031.6 | 632.7 | 452.7 | 65.0% | 235 | |
| 3 | Texas | 31.3 | 8389.8 | 5655.5 | 448.5 | 234.2 | 67.4% | 268 | |
| 4 | New York | 19.9 | 8197.9 | 4918.6 | 491.1 | 423.1 | 60.0% | 413 | |
| 5 | Massachusetts | 7.1 | 6145.1 | 4634.0 | 350.7 | 143.5 | 75.4% | 861 | |
| 6 | Georgia | 11.2 | 5666.5 | 3798.6 | 304.5 | 252.2 | 67.0% | 507 | |
| 7 | Virginia | 8.8 | 5521.0 | 4245.7 | 141.5 | 208.3 | 76.9% | 627 | |
| 8 | North Carolina | 11.1 | 5375.5 | 3802.7 | 285.6 | 202.1 | 70.7% | 487 | |
| 9 | Pennsylvania | 13.1 | 4973.9 | 3215.4 | 276.5 | 262.8 | 64.6% | 380 | |
| 10 | Michigan | 10.1 | 4764.6 | 2976.3 | 348.7 | 205.2 | 62.5% | 470 | |
| 11 | OHIO | 11.9 | 4543.9 | 3012.0 | 305.8 | 203.0 | 66.3% | 497 | |
| 12 | Illinois | 12.7 | 3856.7 | 2579.5 | 179.0 | 218.9 | 66.9% | 303 | |
| 13 | New Jersey | 8.5 | 3632.1 | 2157.6 | 213.9 | 129.5 | 59.4% | 382 | |
| 14 | Maryland | 6.3 | 2715.7 | 1715.5 | 220.3 | 124.7 | 63.2% | 434 | |
| 15 | South Carolina | 5.5 | 2384.7 | 1571.7 | 168.1 | 54.8 | 65.9% | 435 |
(a) Sales excludes video lottery, (b) Latest information available,
The fiscal year ends June 30 for all US states except New York (March 31), Texas (August 31), and Michigan (September 30).
Source: “La Fleur’s 2021 World Lottery Almanac”
The fiscal year ends June 30 for all US states except New York (March 31), Texas (August 31), and Michigan (September 30).
Source: “La Fleur’s 2021 World Lottery Almanac”